ValtorPartnersContact

When a conflict escalates, what actually moves?

Valtor Partners measures it. Independent research on conflict and markets, written so that every number can be checked against where it came from.

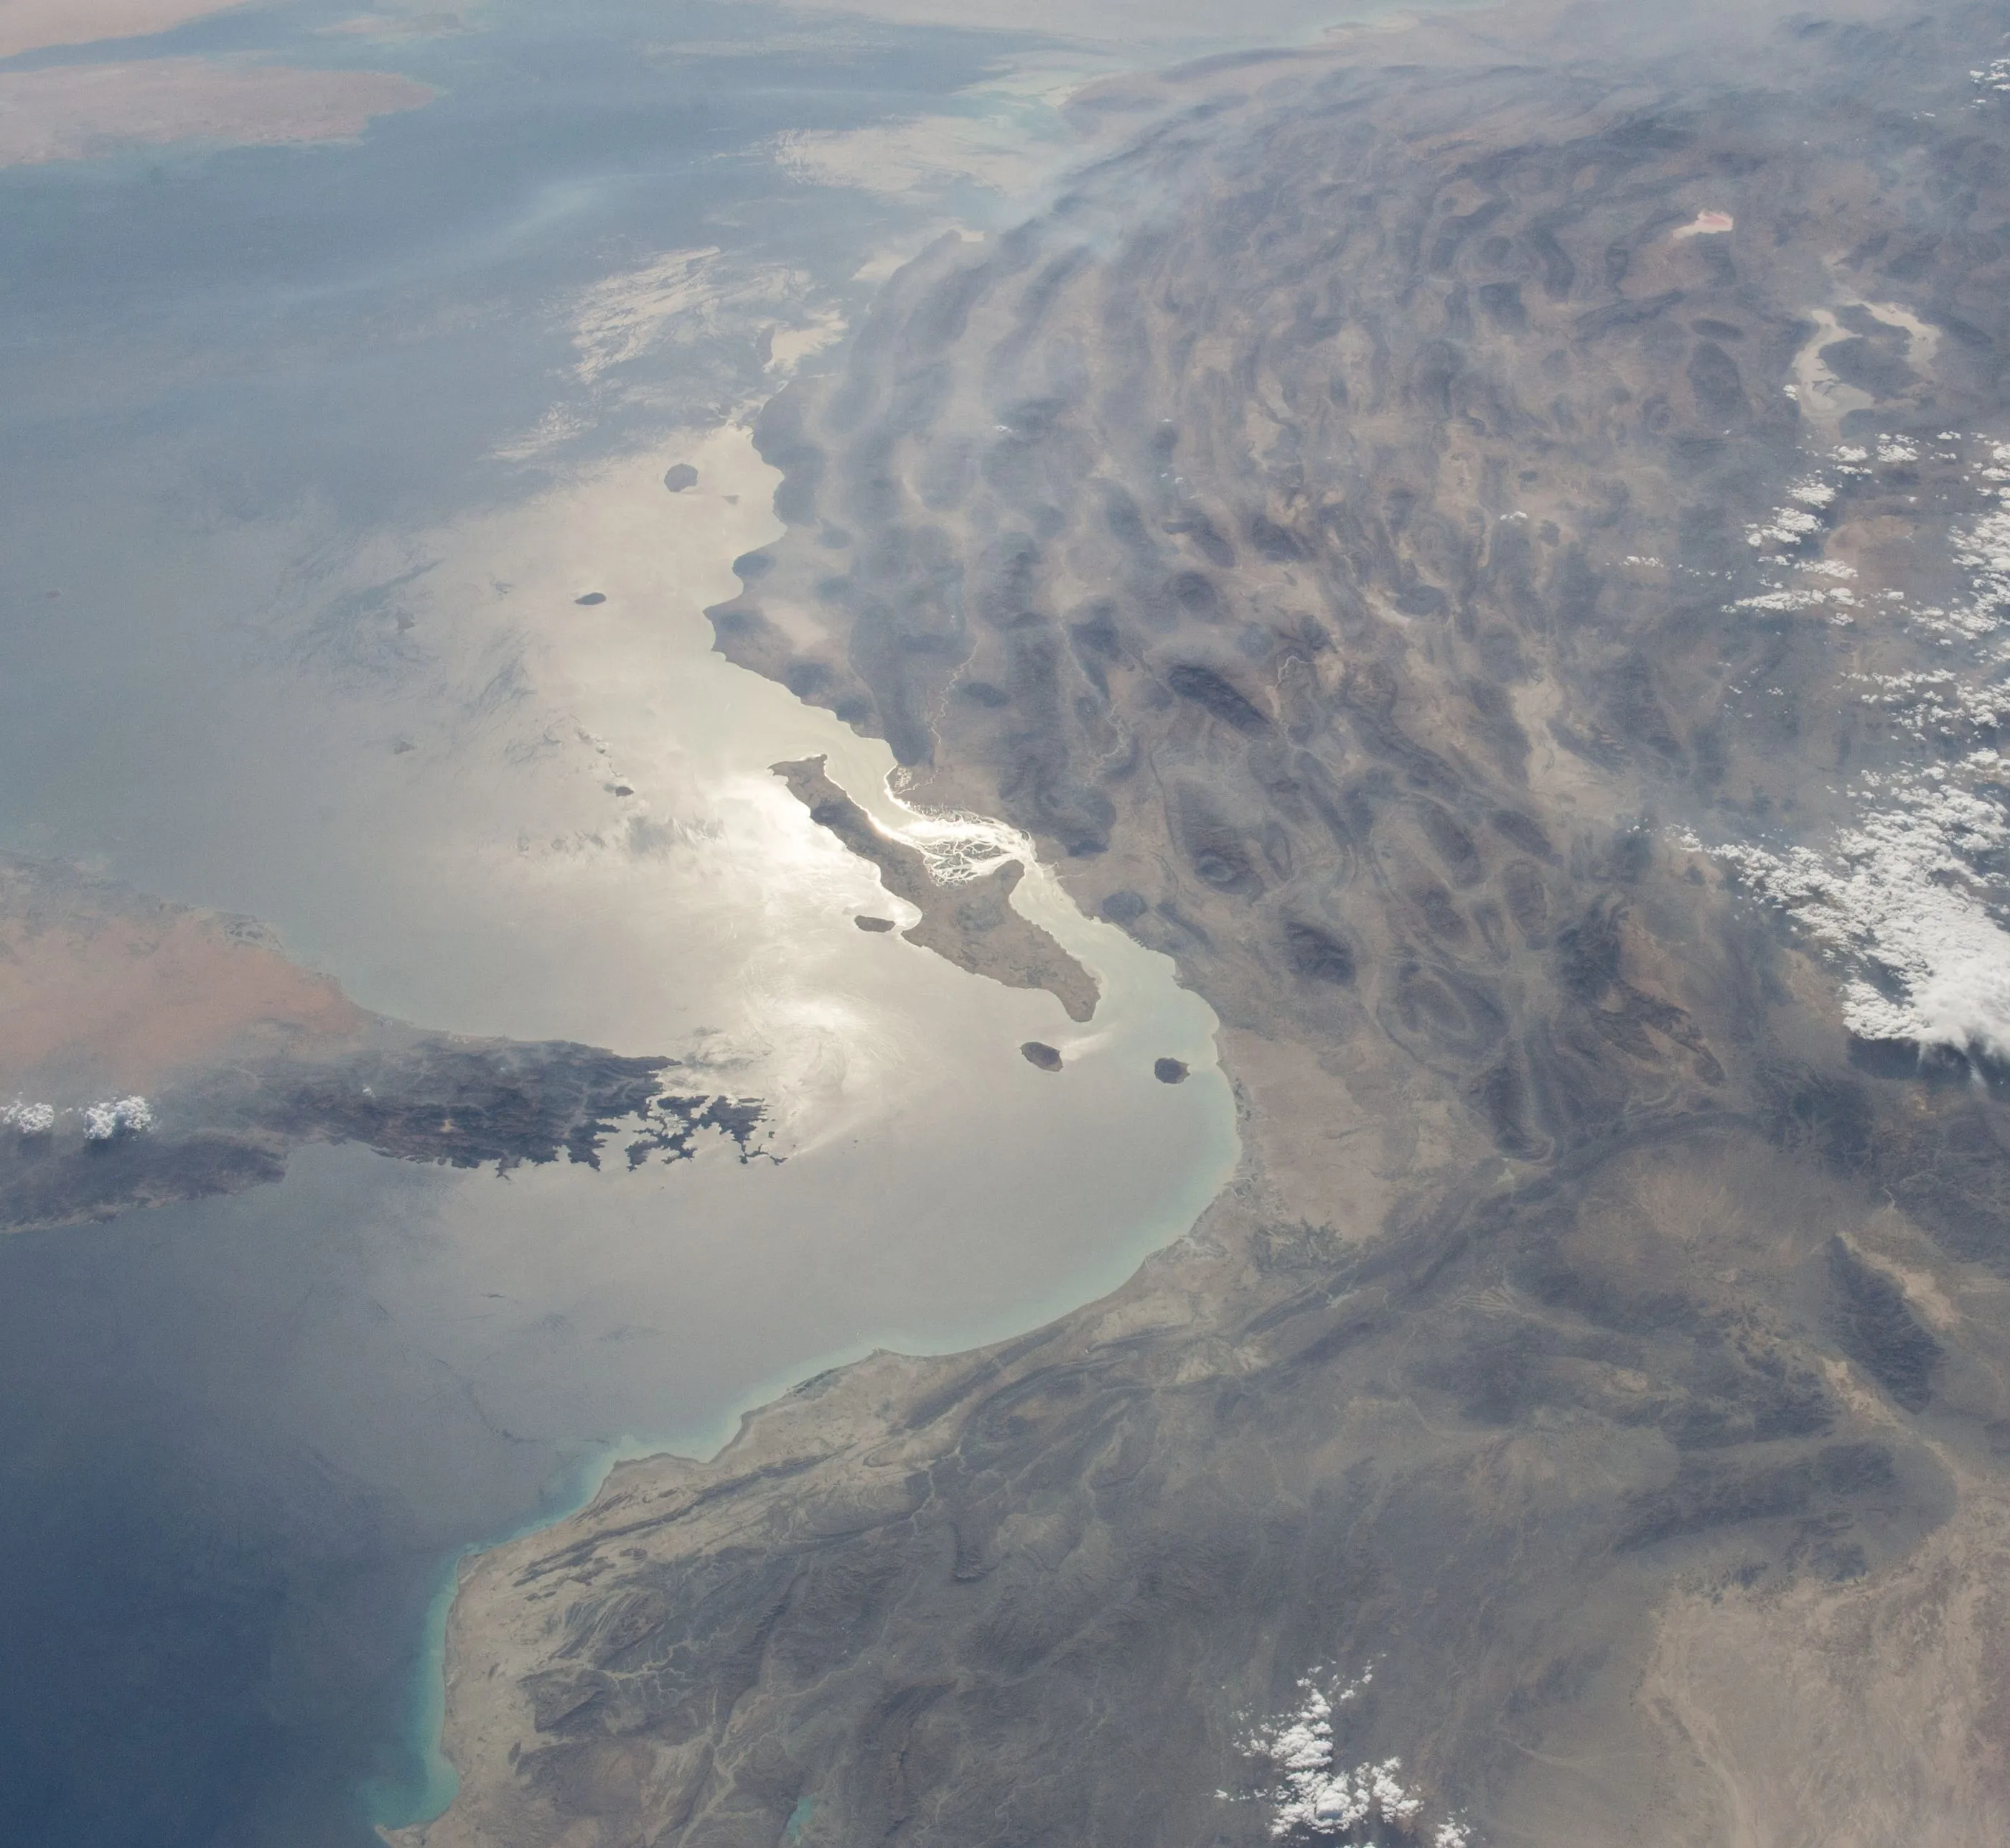
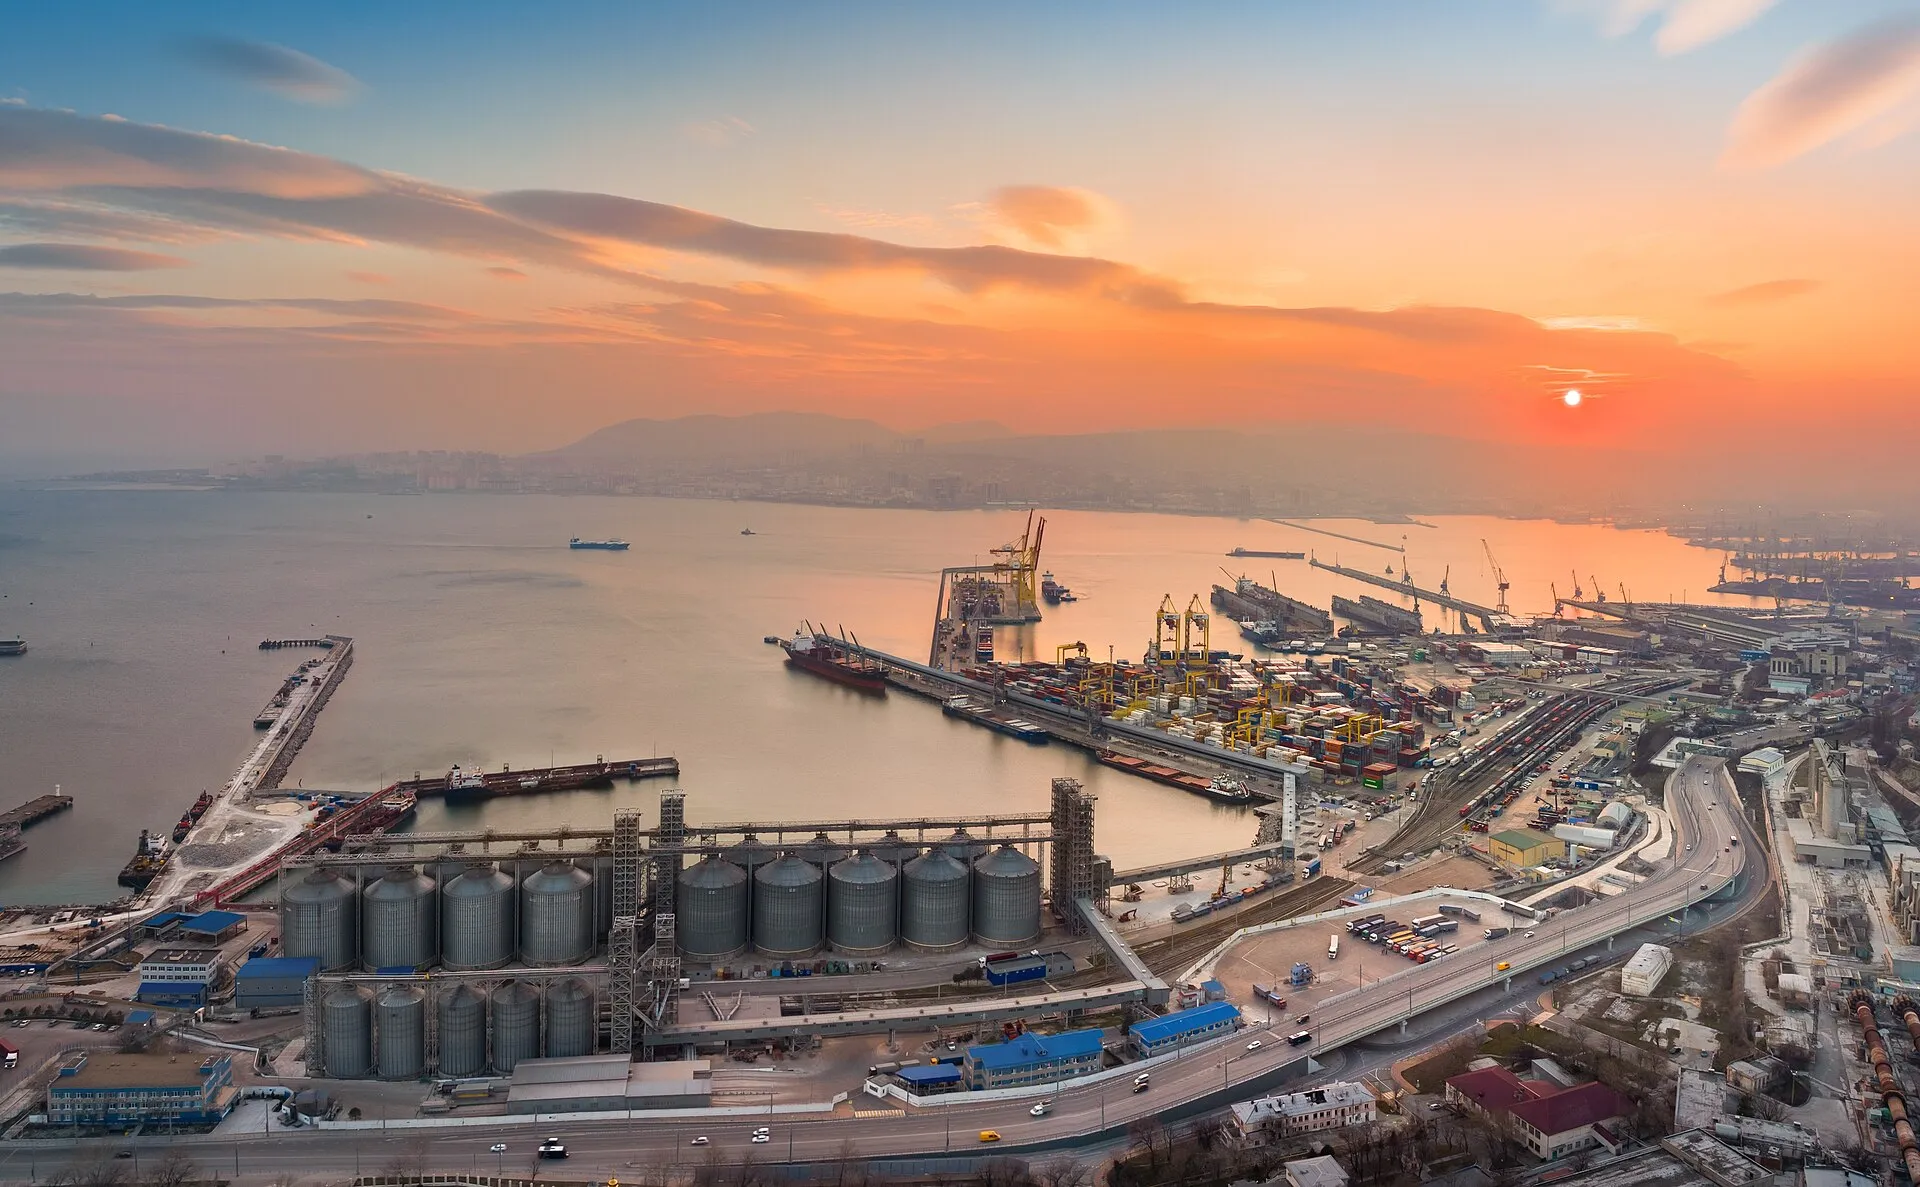
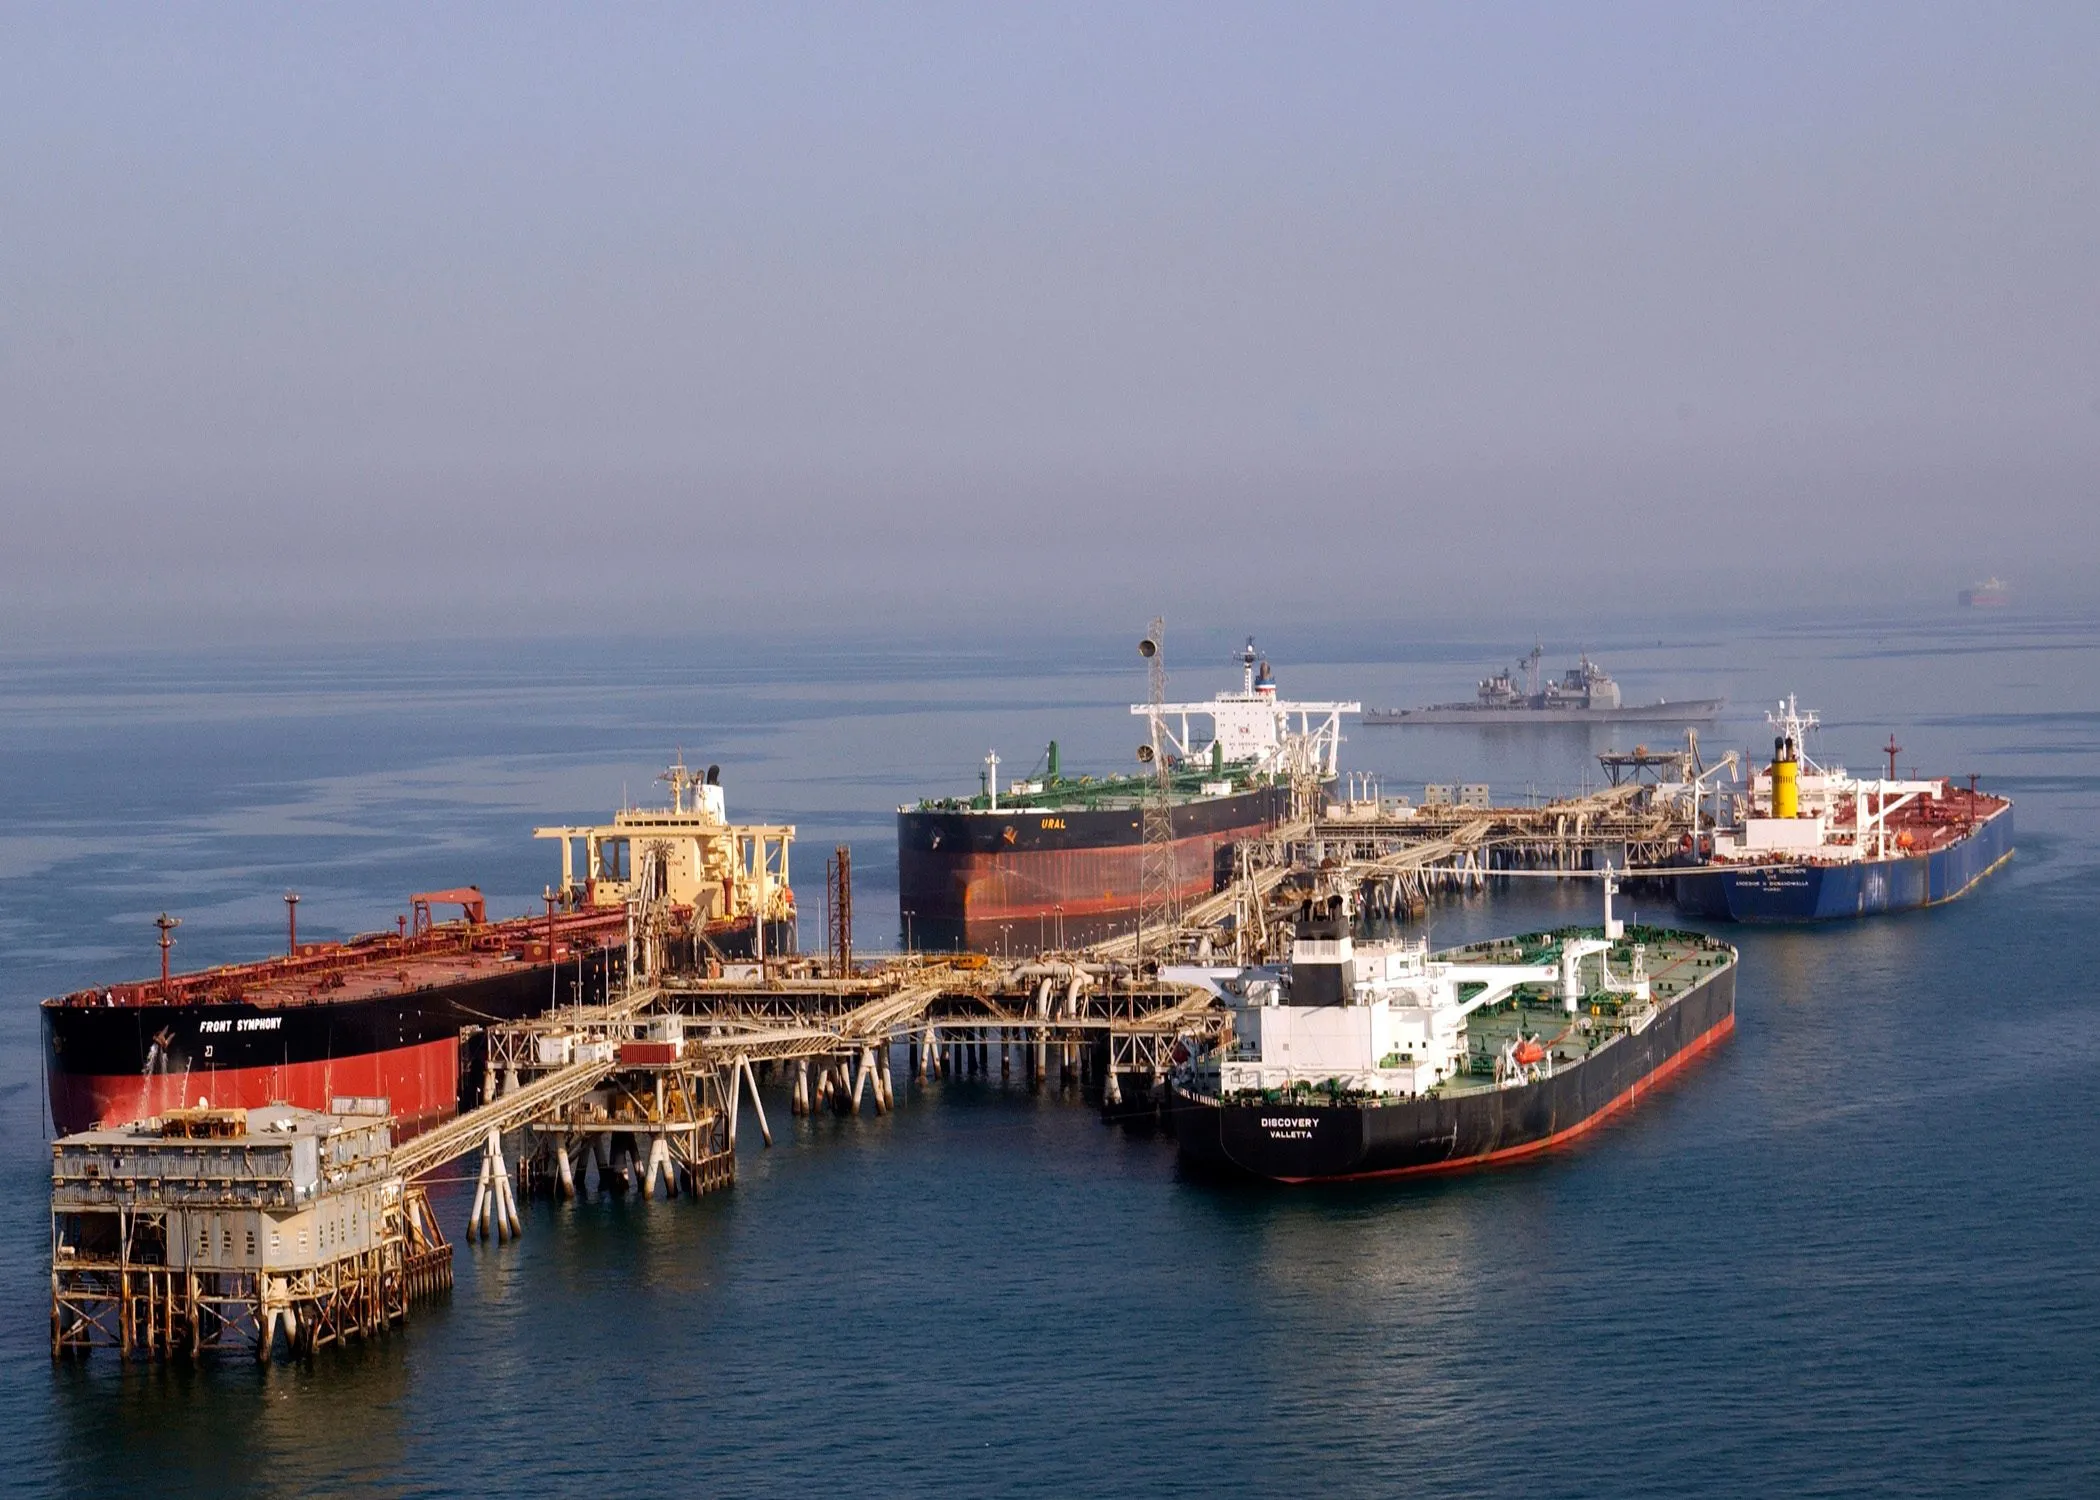
Tankers load at Iraq's Al Basra Oil Terminal in the northern Gulf, September 2004. U.S. Navy, PH2 Samuel W. Shavers, Public domain.

Latest analysis

Not a news service. Each piece picks the story that is being underread and says what it is worth.

Everything published
  • AnalysisStrait of Hormuz, Europe

    The LNG shock stops at the US border

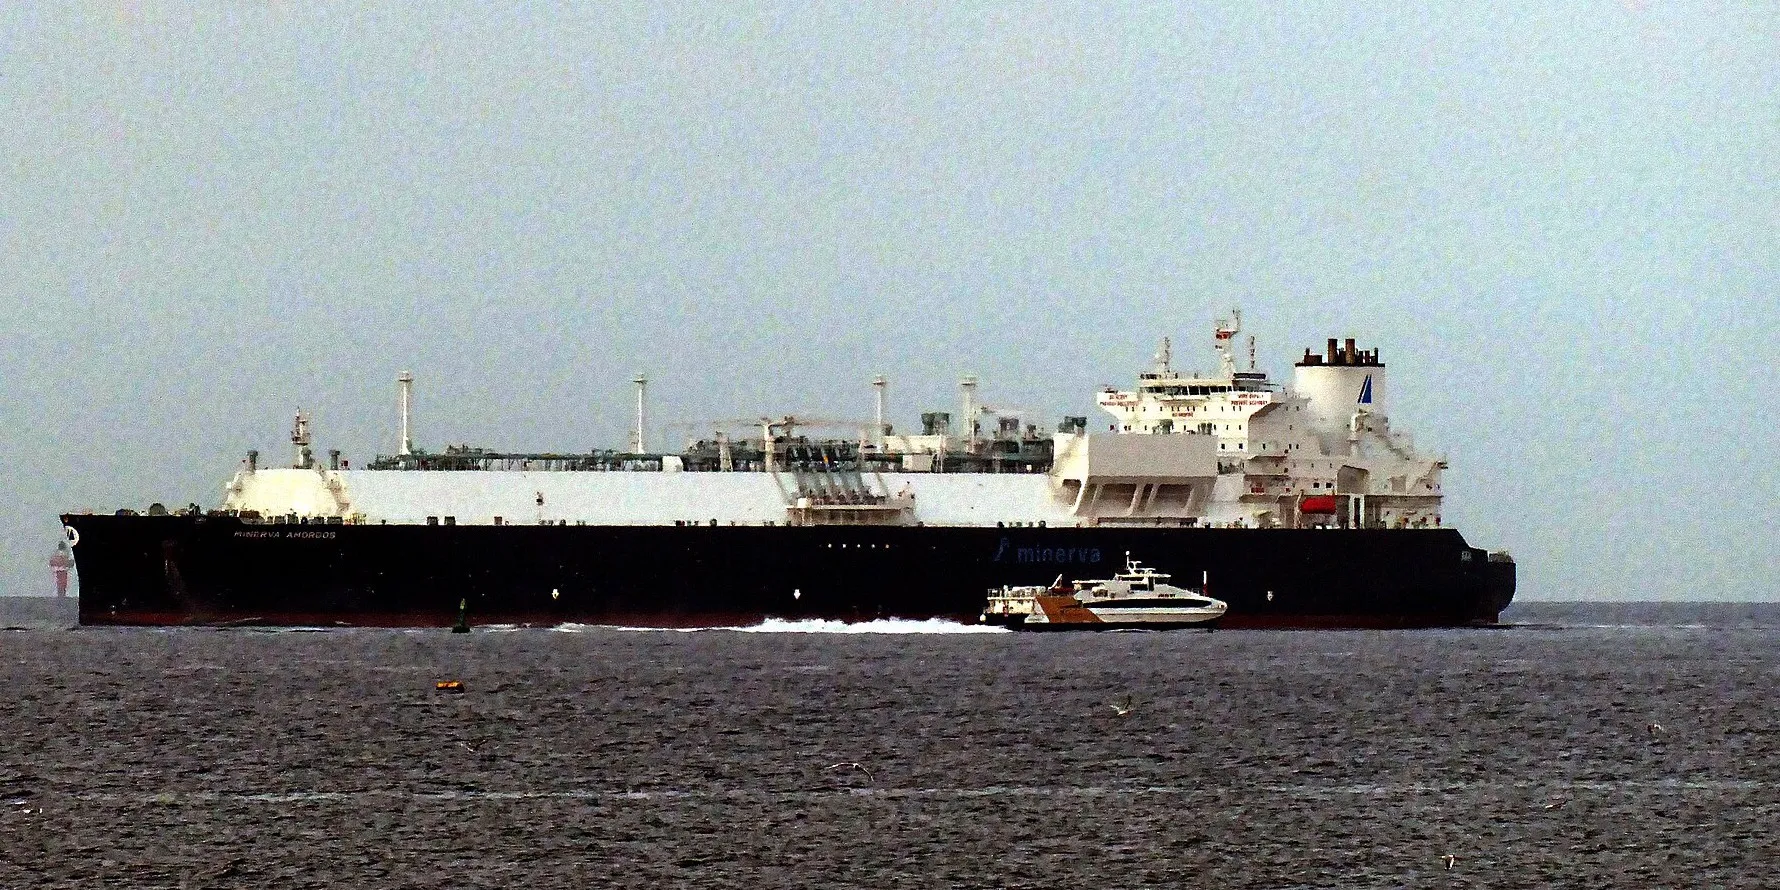
    Qatar shipped 18 cargoes in six months against 509 a year earlier, and Europe enters winter short of gas. Henry Hub is no dearer than it was a year ago.

    5 sourced figures

  • AnalysisTaiwan Strait

    Washington has frozen more than an arms sale to Taiwan

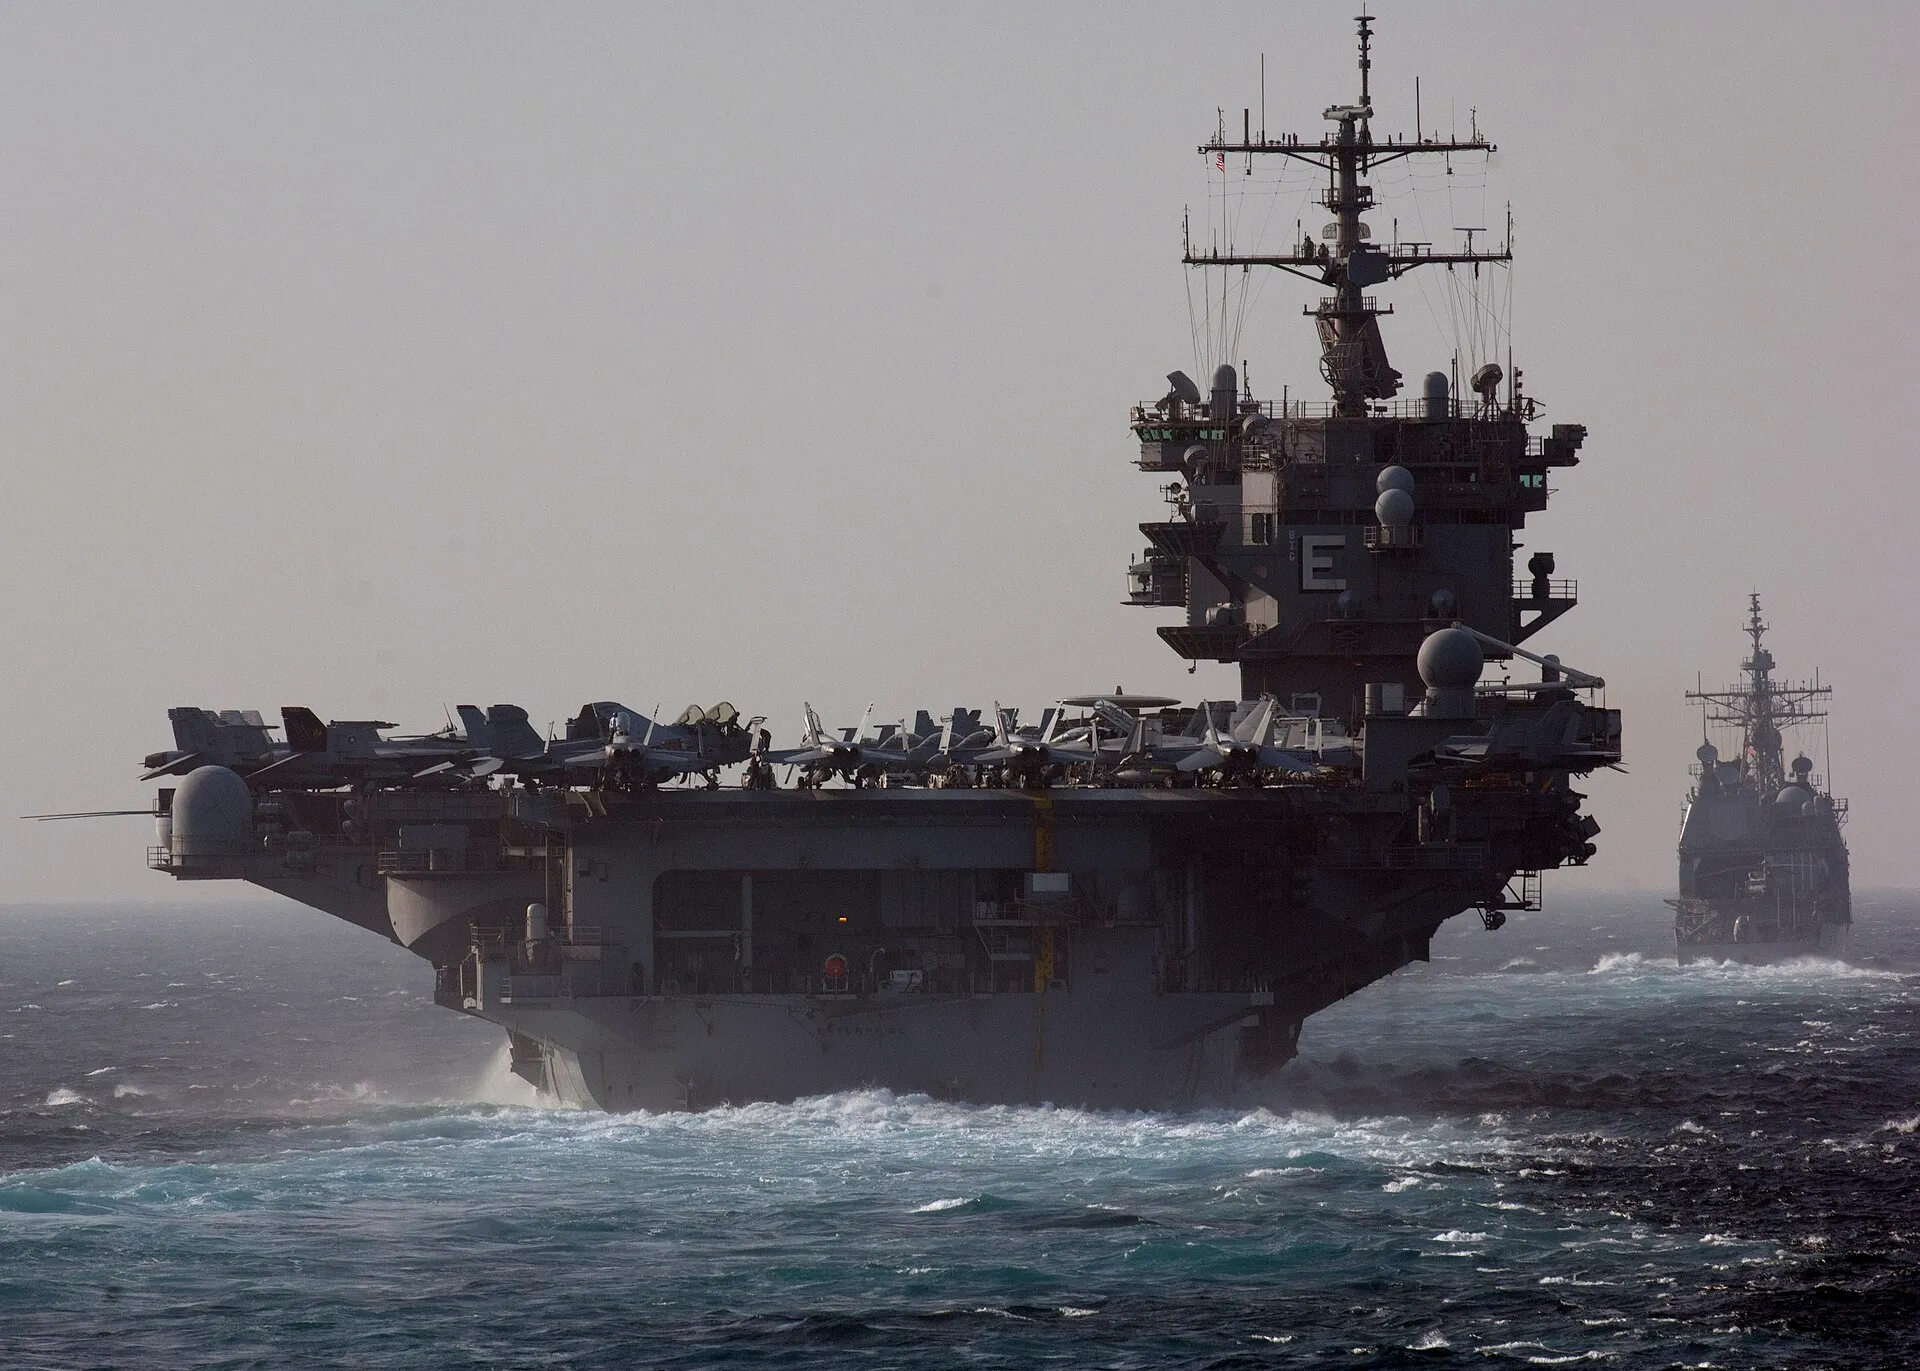
    A $14 billion weapons package and a Pentagon visit to Beijing have stalled since May, and US Navy transits of the Strait have all but stopped. Taipei says nothing has changed, and its stock market set a record.

    4 sourced figures

Short notes

Two readings of risk

One index of the world's news, one of the two sides of the Taiwan Strait. Both are rebuilt from their source data, and every figure on their pages is computed, not typed.

Geopolitical Risk Index

Caldara and Iacoviello's measure of war and terrorism in the news, monthly since 1990. The 1985–2019 average is 100.

146.2

September 2026, higher than 88% of months since January 1990.

Taiwan Strait Tension Index

Valtor's own index, built from the headlines of China's and Taiwan's national news agencies since 2015. The 2015–2024 average is 100.

152.9

September 2026, both sides, down from 161.3 in August 2026.

Every number carries its provenance.

A figure here comes with what it measures, when it was true and where it came from. One that cannot be found is marked as missing, never estimated. Fact, inference and speculation are written as three different claims.

War cover, non-Saudi tanker, Red Sea

What it measures

0.2–0.3% of value

As of

When it was true

Source: Reuters, via Insurance Journal

Where it came from

As it appears in Carriers bet on the Houthis' target list, then switch off their transponders

Report forthcoming, October 2026

Priced or Ignored? How Taiwan's Markets React to PLA Exercises

An event study of Taiwan's country-risk assets around every named PLA exercise since August 2022, and whether any reaction has faded.

Nautical chart of the Taiwan StraitA chart of the Taiwan Strait between 117° and 123° east and 22° and 26.8° north. The coast of Fujian province on the Chinese mainland fills the western, left-hand side; the island of Taiwan lies to the east, on the right, with the Penghu islands in open water between them. Coastlines and the 200 metre depth contour are drawn from Natural Earth data. A magenta line marks the Taiwan Strait median line, running from 27 degrees north 122 degrees east to 23 degrees north 118 degrees east. A tick line across the narrowest part of the strait is labelled 126 kilometres. The chart carries a graticule of latitude and longitude ticks around its border and a scale bar in kilometres.126 kmTAIWANFUJIANPENGHUTAIWAN STRAIT200 mmedian line118°E118°E119°E119°E120°E120°E121°E121°E122°E122°E23°N23°N24°N24°N25°N25°N26°N26°NN050100150km
The Taiwan Strait. Coastlines and the 200 m isobath from Natural Earth; the narrowest crossing measured from that geometry at 126 km. No exercise zones are drawn: those appear in the report, once every date behind them has a primary source.

Coverage

The waters where military activity and shipping economics meet, which is where the path from conflict to price is easiest to measure honestly.

Questions and corrections

A question about a piece or its method, or a number that looks wrong. Corrections are published when they change a finding.

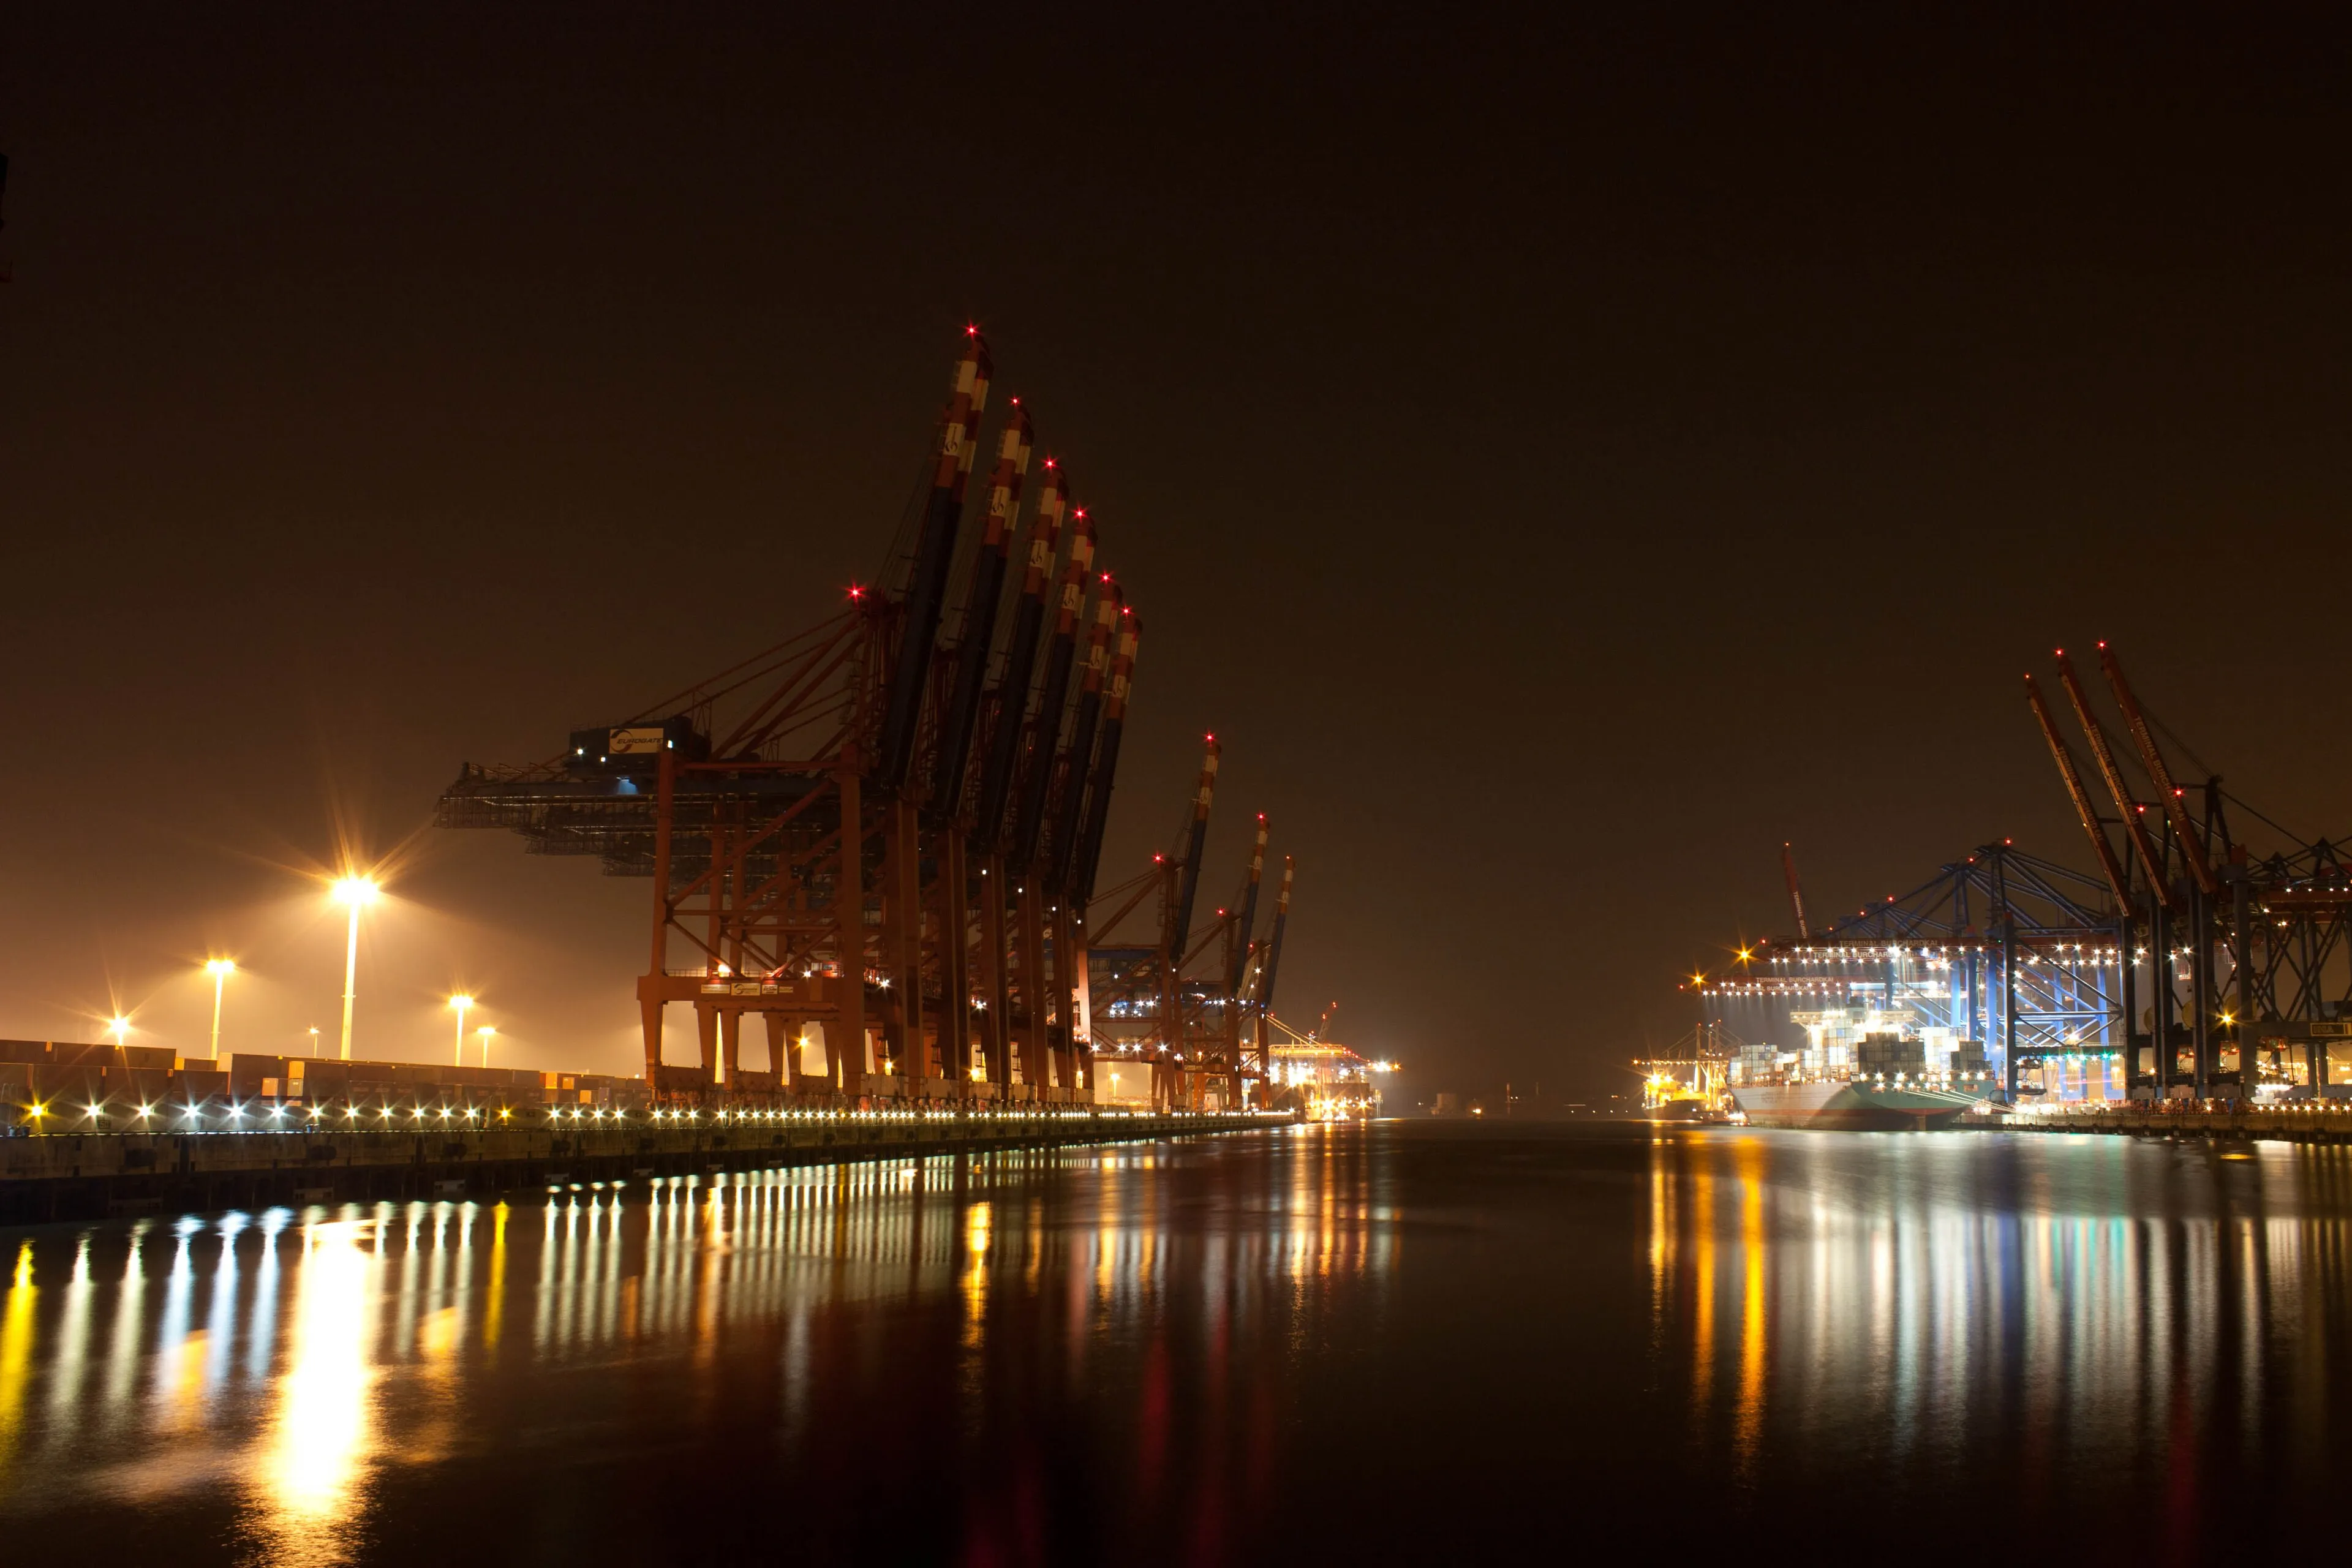
Container terminal, Port of Hamburg, at night. mybroetchen, CC BY 2.0.